Command Center
Primary screen at / — Live now KPIs, zone stock with Minutes-to-empty, SVG venue map, Session tally handoff, and a single restock suggestion when a zone is under pressure.
See which stands are running low — venue heat maps and stock events in a Command Center with two coordinated routes in Next.js.
Working big promotions as a brand hostess, the pain point was always the same: information arriving too late. A stand runs out of drinks mid-afternoon; the coordinator only hears about it hours later through WhatsApp or a manual count. There is no single live picture of which zones are draining stock fastest.
A browser-based Digital Command Center that feels like real ops telemetry:
/, geographic Leaflet on /dashboardtelemetry-store on both routes/dashboardWorking promotions taught me that a dashboard only helps if the numbers stay trustworthy. Python from my degree plus ops experience on activations pushed me toward stable KPIs, capped buffers, and maps that show stock state — not decorative charts.
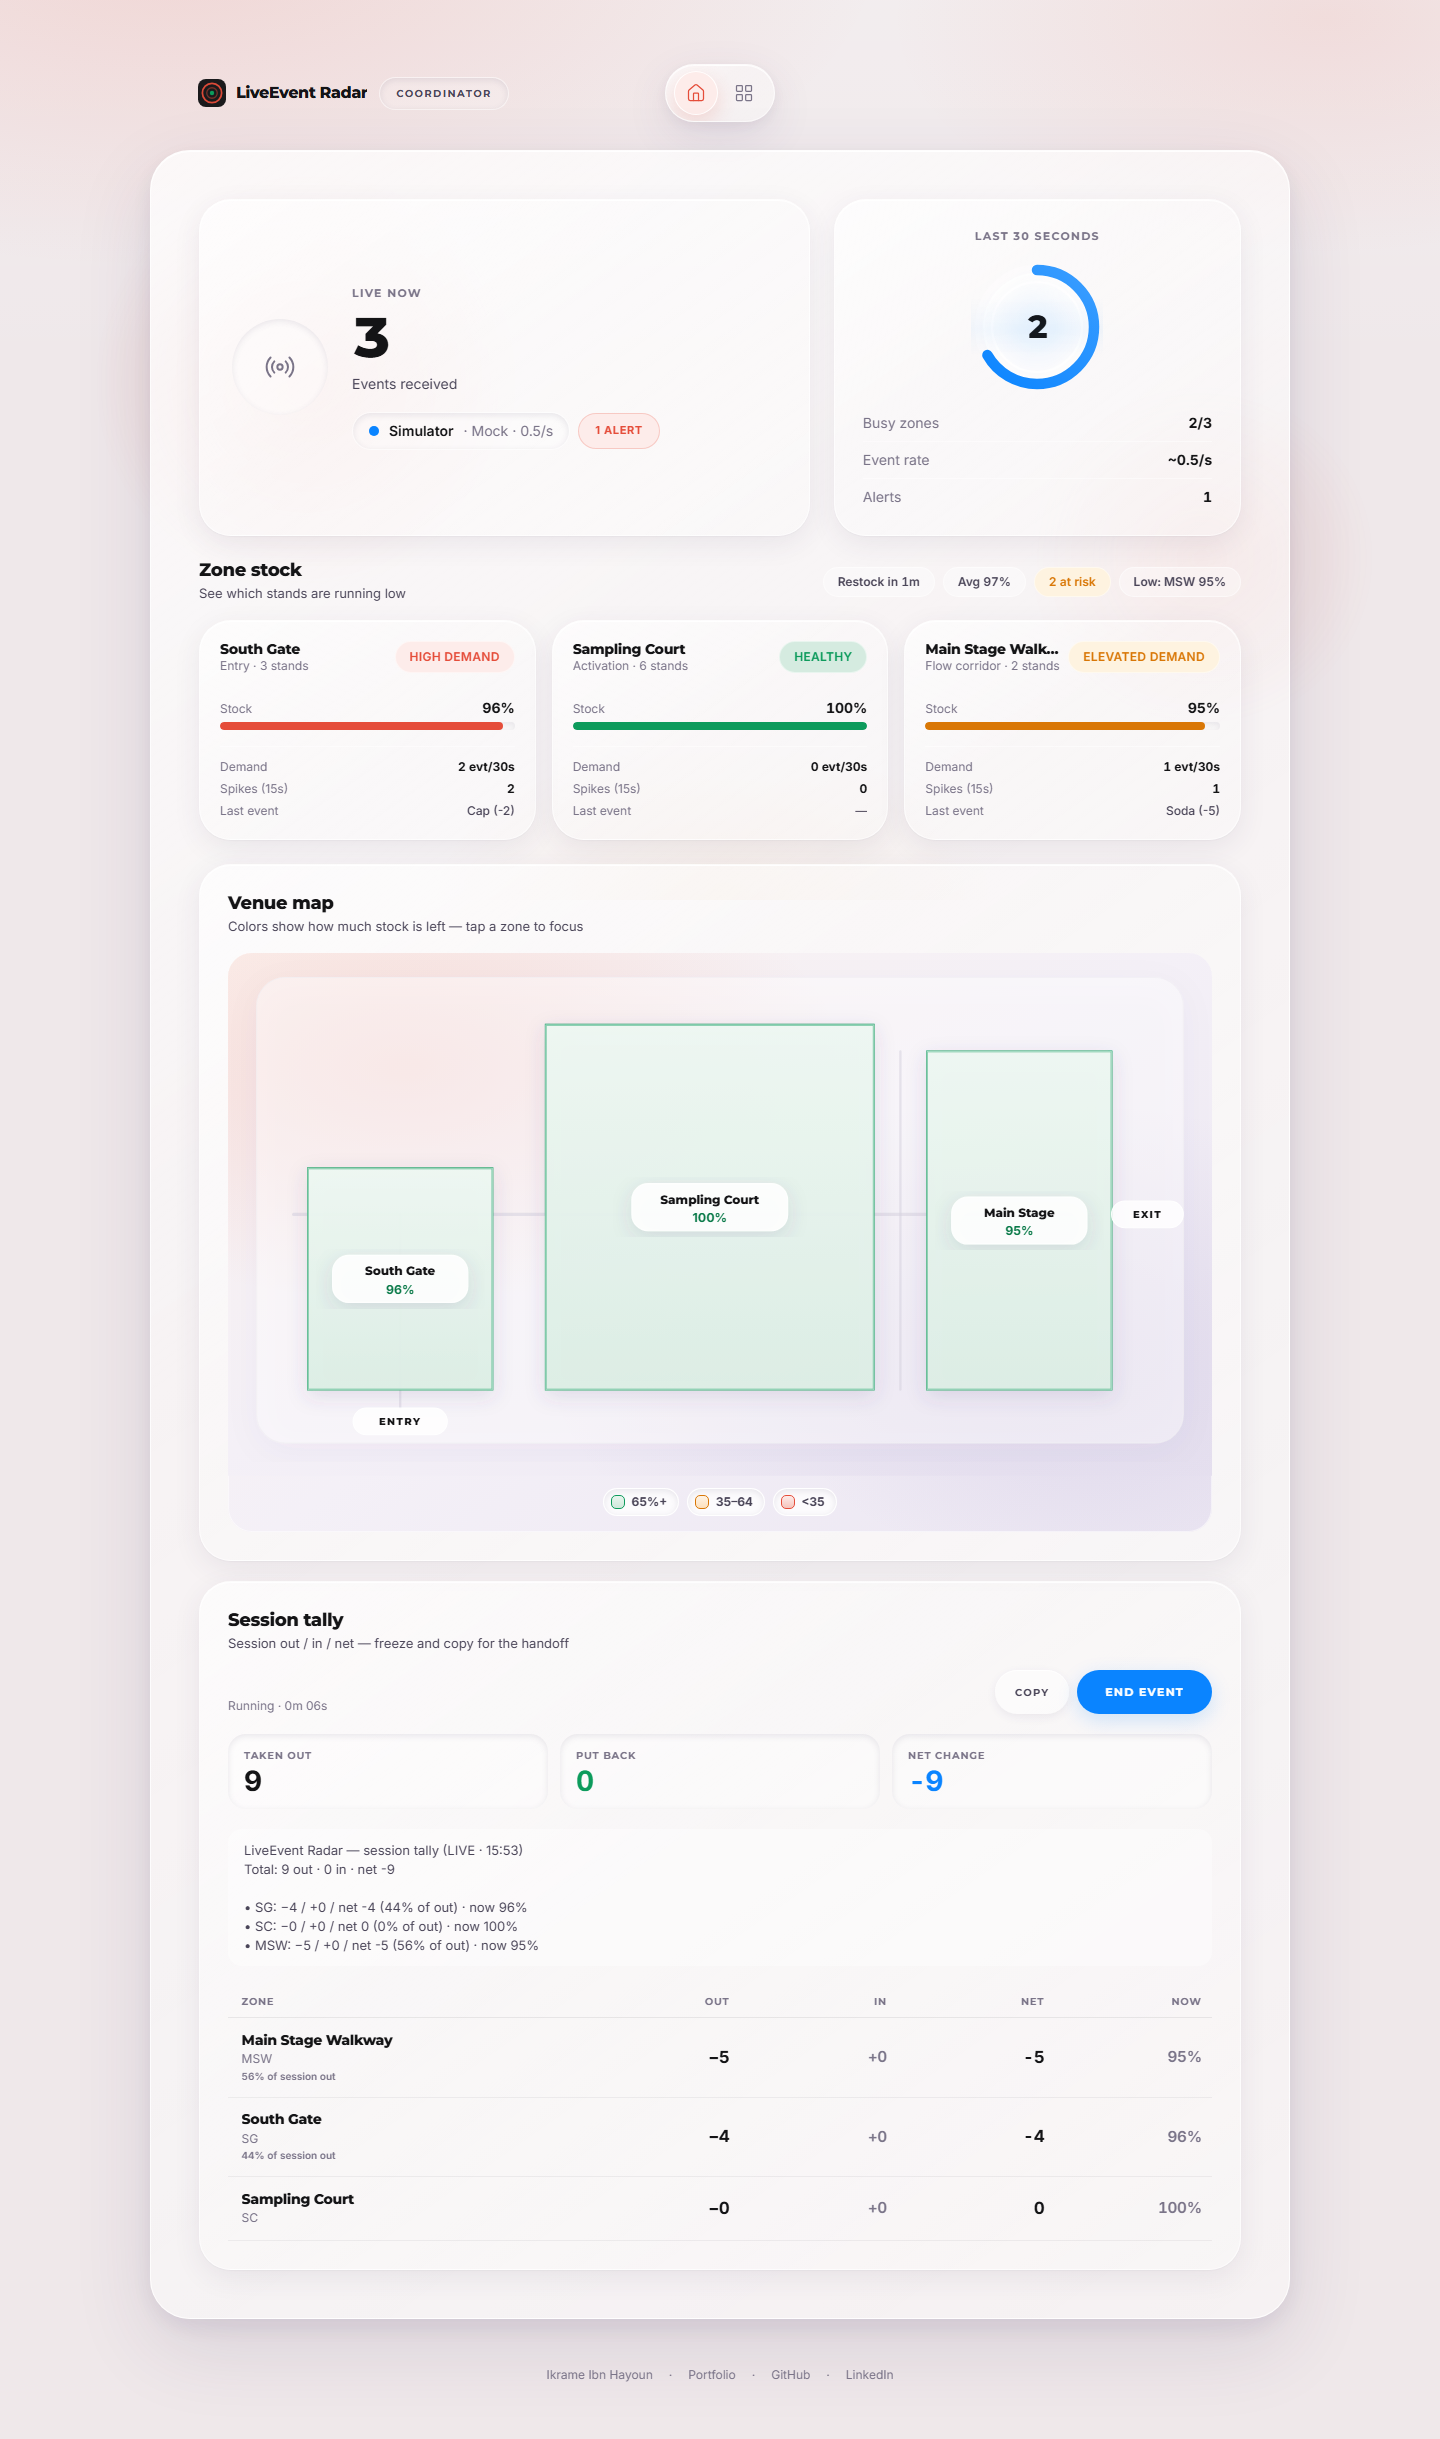
/ — Command Center with zone stock, SVG map, and Session tally
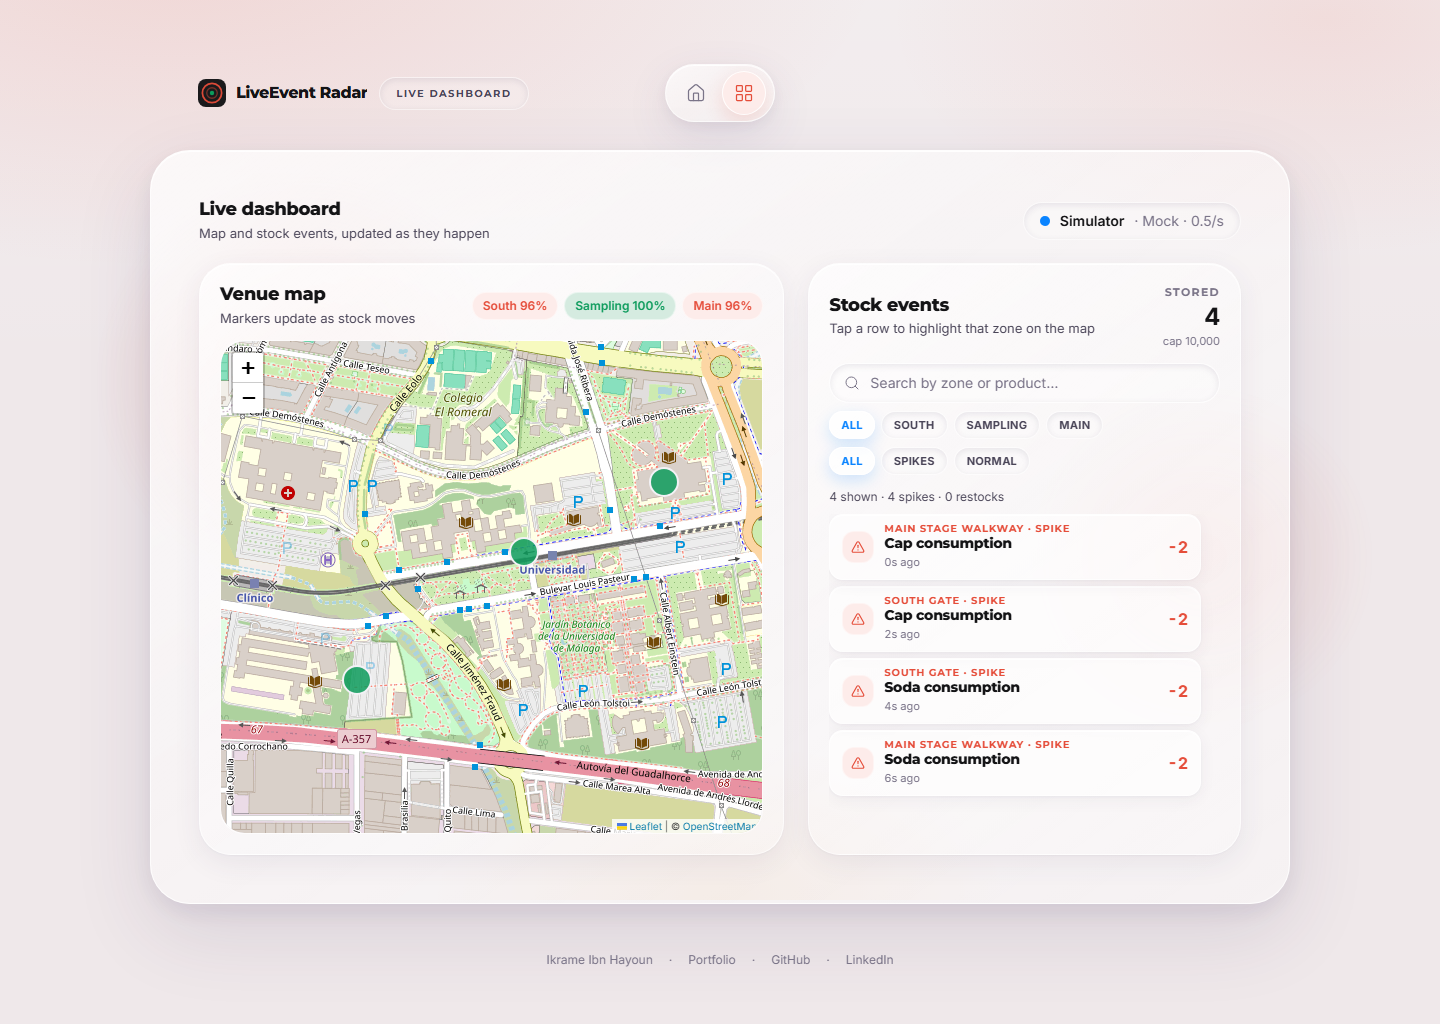
/dashboard — Leaflet map and scrolling stock events
| Route | Role |
|---|---|
/ | Command Center — KPIs, zone stock, SVG venue map, Session tally |
/dashboard | Live dashboard — Leaflet + stock events, filters, worker panel |
Both routes read from telemetry-store. Navigation uses a persistent AppShell and View Transitions so the header never flashes.
Next.js 16 · React 19 · TypeScript · Tailwind CSS v4 · Zustand · Lucide · Leaflet · Vitest · Playwright